
This blog post was authored by Veronica Valeros (@verovaleros)
In this short blog we will describe how to install the T-Pot honeypot framework [1] in a cloud server instance. In this occasion, we chose the cloud provider Digital Ocean [2], which offers a variety of cloud instances or droplets in eight different regions. This blog is divided in three parts: (i) how to create a new Digital Ocean instance, (ii) how to install T-Pot on it, and (iii) a walkthrough to some of the pre-built Kibana T-Pot dashboards.
Creating a new Digital Ocean Droplet
There are a good number of cloud providers out there. The first step is to log in or create a new account in Digital Ocean[2] [referral code]. There’s no particular reason why we are selecting this provider in particular, however we had good experiences with it, its friendliness and how easy to use it is.
Once you are in, the next step is to go and create a new droplet. A droplet is how Digital Ocean refers to a new cloud server.
Step 1: Select the option to create a new droplet or cloud server
The next step is to select the base image that will be used to create this new cloud sever. As recommended by T-Pot developers, we will use the latest Debian image 10 x64.
Step 2: Select Debian 10 x64 (or the latest) as your base image.
The next step is to select the plan and the specs of our new server. In our experience, for running T-Pot the minimum is a 8GB RAM and 4 CPU instance. This will have enough storage and data transfer quota for T-Pot to work well. If your budget allows, consider selecting a plan with more RAM, as with 8GB Kibana will work but it will struggle.
Step 3: Select the plan and specs of the new server.
Now that the base image and specs are defined, we need to consider the region. This will depend on where you are located and the reason behind running T-Pot in the first place. If it is just for fun, we recommend selecting the country closer to home; this will ensure your connection to the server will be the fastest.
Step 4: Select the country where the server will be located.
The next step is to select a form of authentication. There are two options, adding a SSH Key or a password. In this case, we will write down a long and secure password (it can be reset later from Digital Ocean web interface).
Step 4: Select the authentication method: SSH Key or Password.
The last step, is to chose how many droplets or instances we are going to create, and chose a hostname. We will leave these values as default for this occasion.
Step 5: Select how many cloud servers to create and the hostname(s).
We are all set. The last step is to hit ‘Create Droplet’ and wait.
Step 6: All ready, create droplet.
Once the droplet is created, you should see it listed in your project or droplets section. Copy the IP address of the droplet and log-in using SSH:
ssh root@xxx.xxx.xxx.xxxStep 7: Your droplet is ready to install T-Pot.
Installing T-Pot on our new Droplet
We are ready to install T-Pot [1]. T-Pot is an all-in-one honeypot solution or framework. It’s not just one honeypot, but at the time of writing there are 19 different honeypots being installed simultaneously. T-Pot now relies heavily on docker containers and requires a non-filtered internet connection (your IP needs to be able to receive attacks!).
The installation can be done in a few steps: (i) clone the T-Pot git repository, (ii) create a configuration file, (iii) run the T-Pot auto-installer, and (iv) reboot. Let’s walk through these step by step.
Clone the T-Pot Git Repository
The first step once we log in is to install git. We will need git to clone the T-Pot repository:
apt-get -y update && apt-get -y install gitOnce this finishes, we are ready to clone the T-Pot repo:
git clone https://github.com/telekom-security/tpotceAccess the T-Pot directory:
cd tpotce/create a configuration file
The T-Pot auto-installer needs certain parameters for the installation. These values can be specified in a configuration file or via the command line. We will use the first option.
Copy the example configuration file to our home directory:
cp iso/installer/tpot.conf.dist /root/tpot.conf
The next step is to edit this file with our favorite editor. For this use case we will keep the TPOT Flavor as STANDARD, the username will be webuser, and the password will be changed for some secure password we own. After the edition is ready, save and exit.
# tpot configuration file
# myCONF_TPOT_FLAVOR=[STANDARD, SENSOR, INDUSTRIAL, COLLECTOR, NEXTGEN]
myCONF_TPOT_FLAVOR='STANDARD'
myCONF_WEB_USER='webuser'
myCONF_WEB_PW='w3b$ecret'
RUN THE T-POT AUTO-INSTALLER
Once the configuration file is created, we are ready to run the /tpotce/install.sh script. This script performs the full installation of the T-Pot framework, including the ELK instances used to ingest and visualize the data. Ready?
./install.sh --conf=/root/tpot.confThe installation process requires none or minimal user interaction and depending on the internet speed it will last around 30 minutes. The installation script will do a full upgrade of the operating system, install all dependencies needed, download and configure the honeypots, install ELK and configure log stash and Kibana. If everything goes well, which it should, you will see a message on the screen asking to reboot the system.
Once the installation finishes, and the system reboots, the normal (not honeypot) SSH will be moved to port 64295. Next time you login you will have to specify the port in the SSH command:
ssh -p 64295 root@xxx.xxx.xxx.xxxPre-built Kibana T-Pot dashboards
Now that the installation finished and the server has been reboot, we can access the web interface and the Kibana dashboards. Go to Firefox (Google Chrome may block the access due the use of a self-signed certificate), and access the T-Pot console in port 64297:
https://xxx.xxx.xxx.xxx:64297If things go well, and the cloud server has enough memory (8GB minimum!) , you should see a panel like the one shown below.
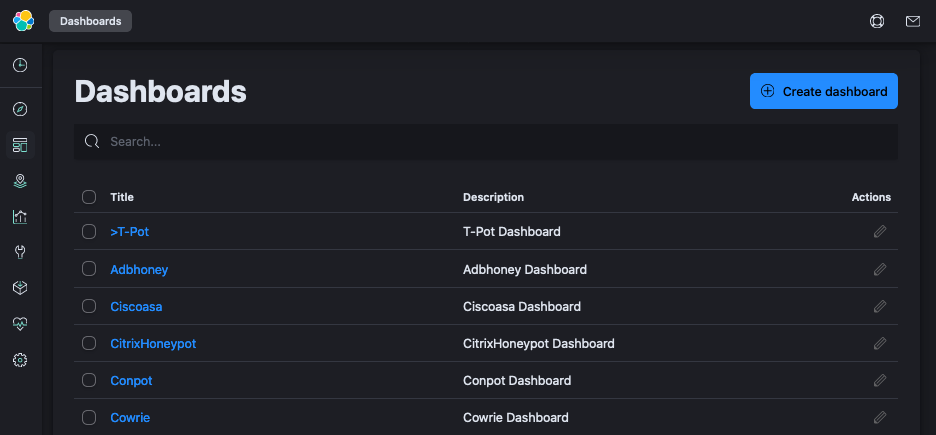
We will go straight to the Kibana dashboards, which after clicking on in the panel above should lead us to a new tab with the interface shown below. The Dashboard section contains a list of pre-built dashboards by the T-Pot team. The >T-Pot dashboard will show us all the data together, in one place, while the other dashboards will show data of a specific honeypot.
>T-Pot Dashboard
The main dashboard is >T-Pot and it contains aggregated data from all 19 honeypots. Each honeypot provides different data, however, they all have a common base of networking data that is used to get some generic metrics (IP addresses, ports, etc).
The first panel of the dashboard will contain a list of attacks per honeypot. If there are no attacks in a given honeypot, it will not be shown.


T-Pot does a great job using GeoIP data to show the origin of attacks, as well as Suricata to show alerts on Suricata traffic rules. The information is also enriched by adding the Autonomous System (AS) and AS Name (ASN), as well as adding IP lookup links to Talos Intelligence to search for IP reputation.
All the dashboards are interactive. Clicking on certain fields will trigger a filter on the data, and selecting a time range will add a time selection. Both actions will be applied to all the dashboard.
honeytrap Dashboard
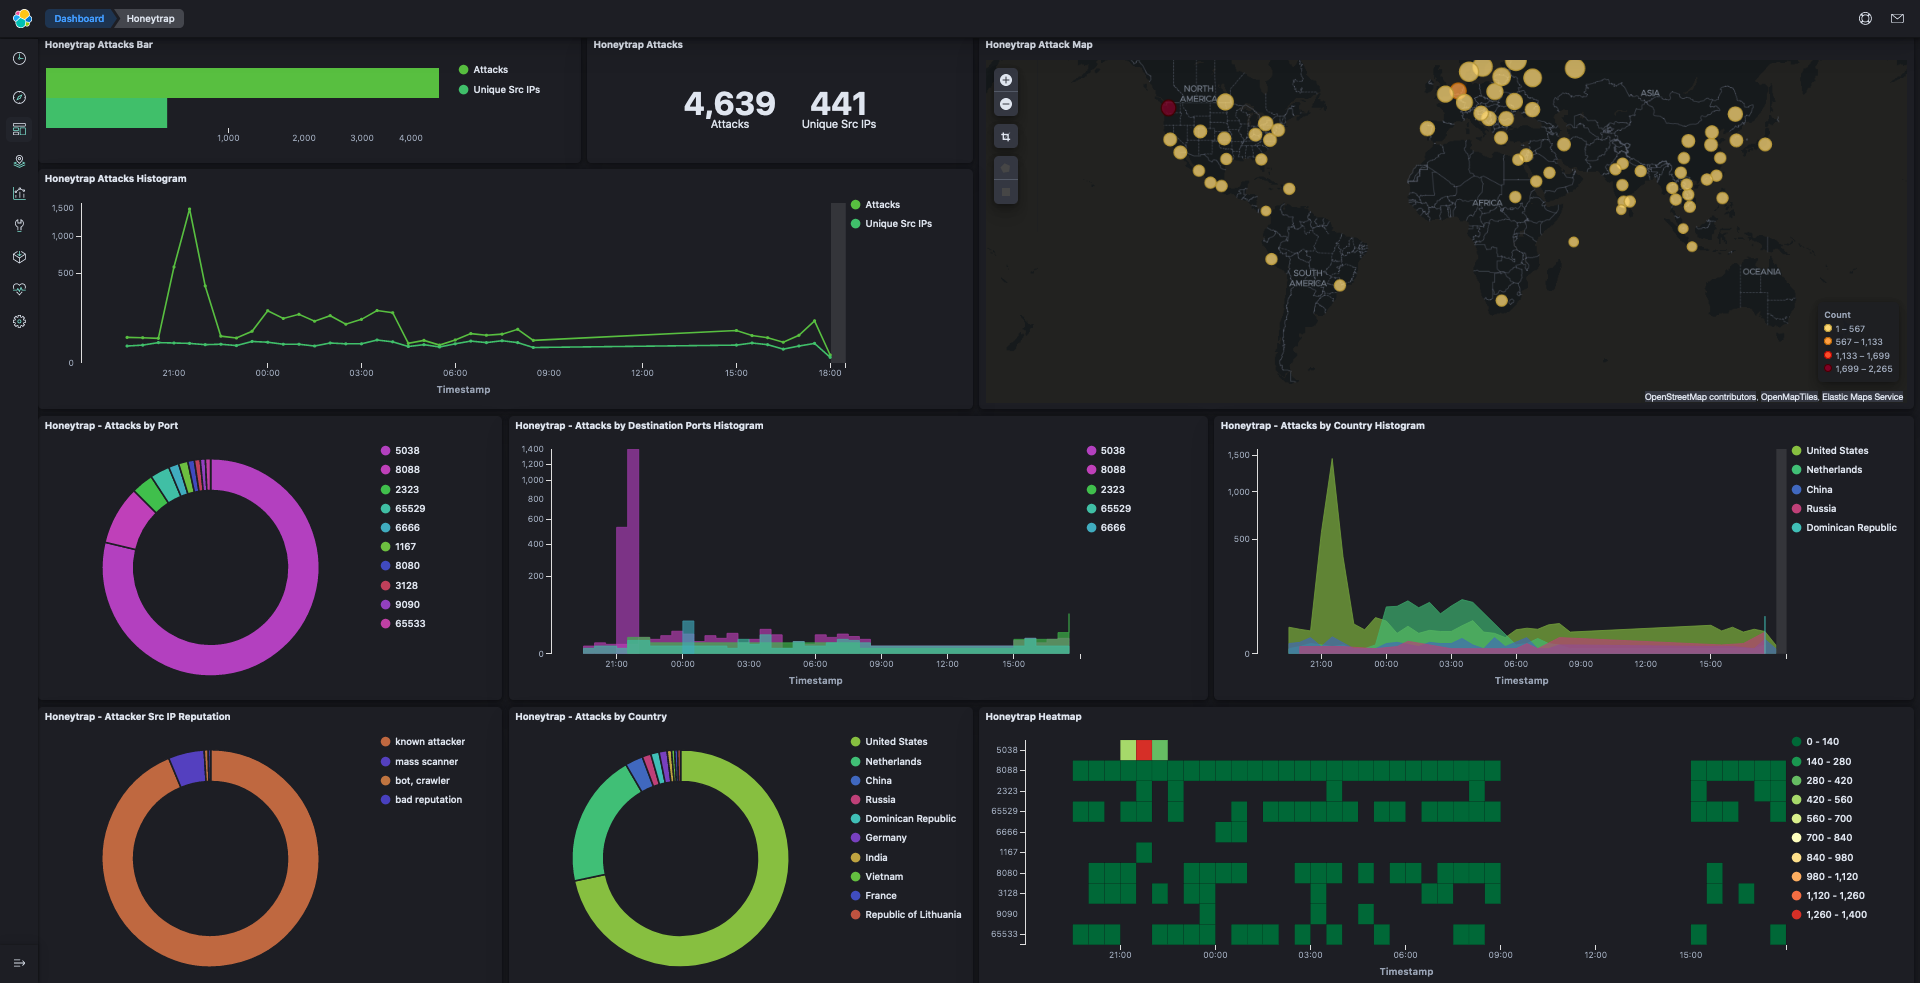
As we mentioned, T-Pot has individual dashboards. As an example, we will show the dashboard of Honeytrap. T-Pot has many different type of honeypots, some are application specific (SSH, Telnet, Elastic, SAP). There are however other honeypots that have a more general focus, such as Honeytrap [3]. Honeytrap is designed to monitor and study attacks against TCP or UDP services, and it’s application independent. There’s a wonderful pre-built dashboard in T-Pot that can be seen below.
Conclusion
Running honeypots is a very fun activity and nowadays is very simple to do. Most cloud providers give away free credit after signup that can be used to run a good honeypot for at least a couple of weeks. T-Pot has done an incredible job putting this framework together, and it’s an excellent learning opportunity for those that want to get started but do not know well which honeypot to focus on.
Update: 18th October 2020
Unfortunately, after a few days, most of the T-Pot instances I’ve set up crashed. This was due to memory issues. It seems that 8GB of RAM is not enough to have a T-Pot instance running for a long time, and thus, it’s better to have 16GB of RAT for a smooth deployment.
References
[1] T-Pot - The All In One Honeypot Platform, https://github.com/telekom-security/tpotce. Accessed on 10/10/2020.
[2] Digital Ocean cloud provider, https://cloud.digitalocean.com/. Accessed on 10/10/2020.
[3] Honeytrap, https://github.com/armedpot/honeytrap/ . Accessed on 10/10/2020.